.svg)


Alpha Theory 2025 Year in Review: Position Sizing as a Persistent Edge
Over 14 years and 200+ funds, Alpha Theory’s data shows that systematically aligning position size with conviction and keeping price targets fresh materially improves portfolio performance.
The Implementation Gap: Why Research Alpha Often Fails to Reach the Portfolio
For many active managers, the challenge is not research effort.
It is not idea quality.
It is a translation problem: converting research conviction into portfolio exposure.
Most active investment teams spend their days building models, debating investment theses, updating price targets, and deepening their understanding of companies. Many teams are skilled at fundamental analysis and generating differentiated ideas.
The harder problem, and the one that often costs more alpha than managers realize, is appropriately sizing those securities.
After 14 years of data across 200+ managers, more than one million price target forecasts, and every market cycle from the post-GFC recovery through COVID and beyond, the conclusion is consistent: the gap between what managers know and what they own is real, persistent, and expensive.
The Gap Between What You Know and What You Own
The gap between what managers own and what their research says they should own becomes visible when we compare two portfolios.
Alpha Theory’s dataset tracks two portfolios for each client:
- “Actual” portfolio: how the manager actually sized and traded
- “Optimal” portfolio: how the portfolio would have been sized if the manager consistently applied Alpha Theory’s Optimal Position Size (OPS)framework.
The Optimal portfolio is not an outside model or black box optimizer. Instead, it’s the manager’s own price targets, probabilities, conviction levels, and risk constraints applied consistently and without the behavioral noise that creeps into day-to-day sizing decisions.
Across the past 14 years, the Optimal portfolio has outperformed Actual by an average of +3.9% annualized.

That 3.9% annual edge compounds dramatically. Across 14 years, the Optimal portfolio generated a cumulative return of 373.7% compared to 191.7% for the Actual portfolio. That’s nearly twice the total wealth from the same underlying ideas. The Optimal result is also more than 2.6x the average hedge fund return of 142.2% over the same period.
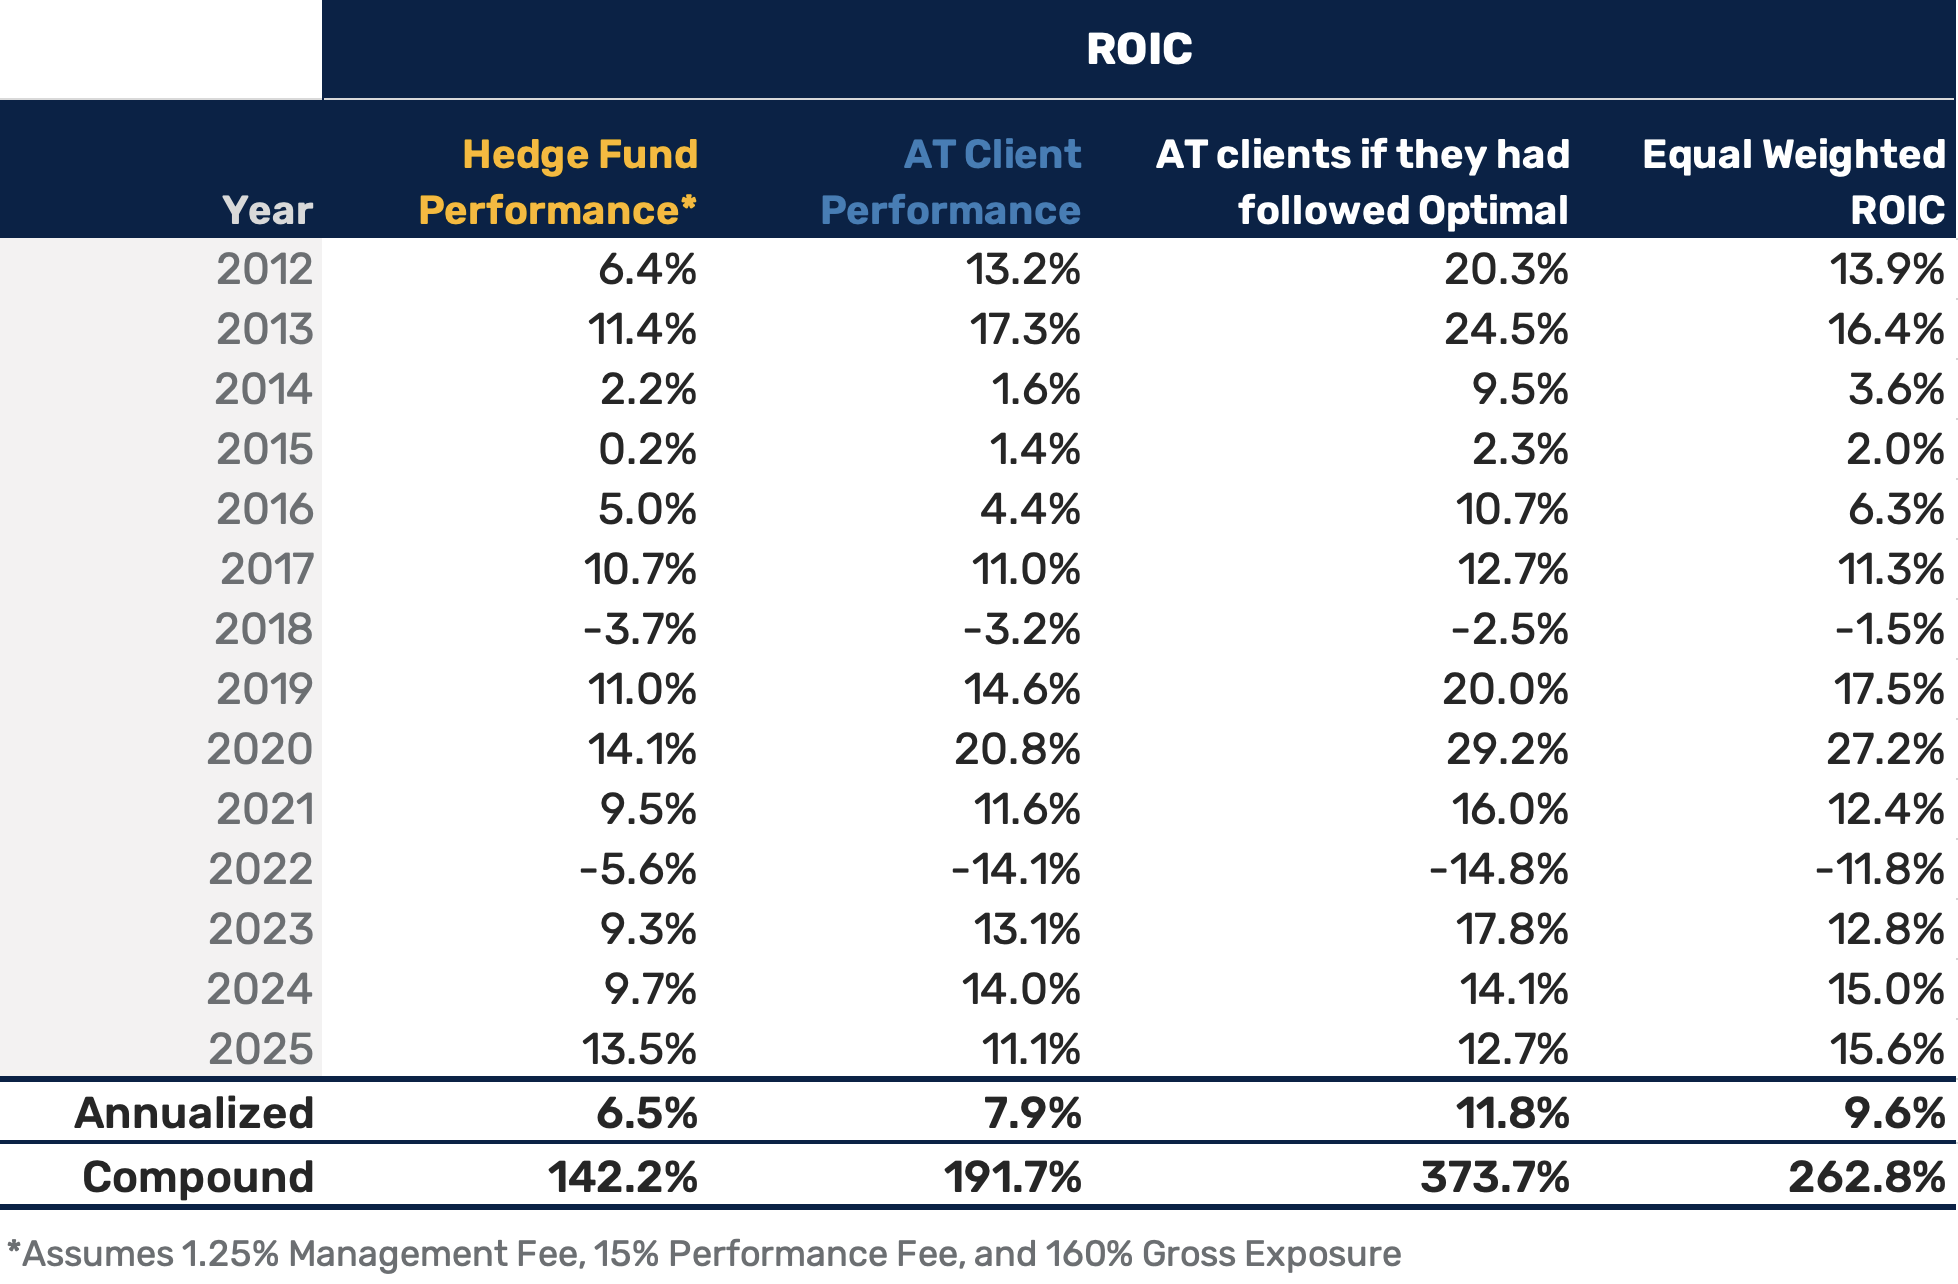
Because Alpha Theory clients operate with ~125% leverage vs. the industry median of ~150%, we use Return on Invested Capital (ROIC) rather than total return. ROIC normalizes leverage and isolates position-level decision-making quality, which is exactly what we want to measure here.
How Often Does It Work?
On average, the Optimal portfolio has outperformed Actual in 13 of 14 years — a 93%-win rate. This consistency has held through bull markets, corrections, and COVID. It is not the result of luck.
Optimal doesn’t win every position or every client every year. But it doesn’t need to:
- By Position: Optimal sizing wins 57% of the time — a modest edge per position, but powerful at scale.
- By Client: Optimal outperforms for 67% of clients in any given year.
Those aren’t overwhelming margins, but the compounding power of the disciplined sizing process is real. Applied consistently across hundreds of positions and many years, the difference between Actual and Optimal sizing compounds dramatically. In our dataset, that difference amounts to nearly twice the cumulative return. That is the power of process.
The Implementation Gap: An Industry-Wide Problem
Most active managers are familiar with the comparison. According to the latest SPIVA data, over a 20-year period, 94.1% of all domestic equity funds underperformed the S&P 1500 Composite Index. It’s a sobering statistic.
The implication is clear: most active managers struggle to convert their research into benchmark-beating performance.
Our analysis suggests that the gap often lies not in idea generation or research, but in how insights are translated into position sizes.
The Alpha Theory Optimal portfolio reflects what managers might have earned had they consistently sized positions using their own research inputs. In our dataset, applying those research-based position sizes increases annual returns from 7.9% to 11.8%.
Improvements of ~4% would materially reduce the number of managers who fall short of their benchmarks.
To better understand the role of sizing, it is useful to compare active portfolios with a simple benchmark: equal weighting.
An equal-weighted portfolio, which is pure stock selection with no sizing skill applied, outperforms active managers’ sizing by 1.7% annually (9.6% vs. 7.9%). Active sizing, the activity managers devote enormous amounts of energy to, reduces returns on average in our dataset.
Why does active sizing reduce returns? In our dataset, discretionary sizing often breaks the link between research conviction and portfolio exposure. Ideas are not consistently sized to match their expected return. The result is a persistent gap between research conviction and capital allocation.
The solution is not to abandon sizing, but to structure it. In our dataset, when those same research insights are applied through a disciplined sizing framework, they outperform equal weight by an additional 2.2%. That is the real advantage: not better stock selection, but better alignment between capital and conviction.
Broader industry data supports the value of structured sizing. In their long portfolios, Alpha Theory clients generated approximately +200bps of sizing return vs. +33bps for the ~1,200 funds analyzed by Novus (a spread highlighted in The Ultimate Position Sizing Guide). This suggests that managers using a structured framework capture more of the value embedded in their research than the industry average manager.
The difference appears to be structural. OPS is a consistent, research-driven sizing framework, while most funds rely on discretionary, ad hoc adjustments.
Three Steps to Close the Gap
The implementation gap that we have observed is not mysterious. It is behavioral and procedural. Across our dataset, three observable practices consistently distinguish managers whose research translates into performance from those who do not.
1. Start With Price Targets
It sounds obvious. But our data shows it makes a massive difference.
On a ROIC basis, long equity positions with price targets deliver returns 5.7% higher than those without. On the short side, the effect is even larger: positions with price targets outperform by 6.4%.
.png)
Investors who avoid price targets citing false precision are solving the wrong problem. The value of a price target isn't precision; it's explicitness. A documented price target creates a consistently structured framework for evaluating assumptions, identifying when a thesis has changed, and communicating conviction consistently across the team. It turns intuition into a discussable, revisable artifact.
2. Keep Price Targets Fresh
Setting a price target is step one. Keeping it current drives additional returns.
We observed meaningful performance improvements across our entire client base for both long and short positions when price targets are kept fresh. Compared to stale targets (90 days or older), fresh price targets are associated with ROIC increases of 1.6% on the long side and 2.9% on the short side.
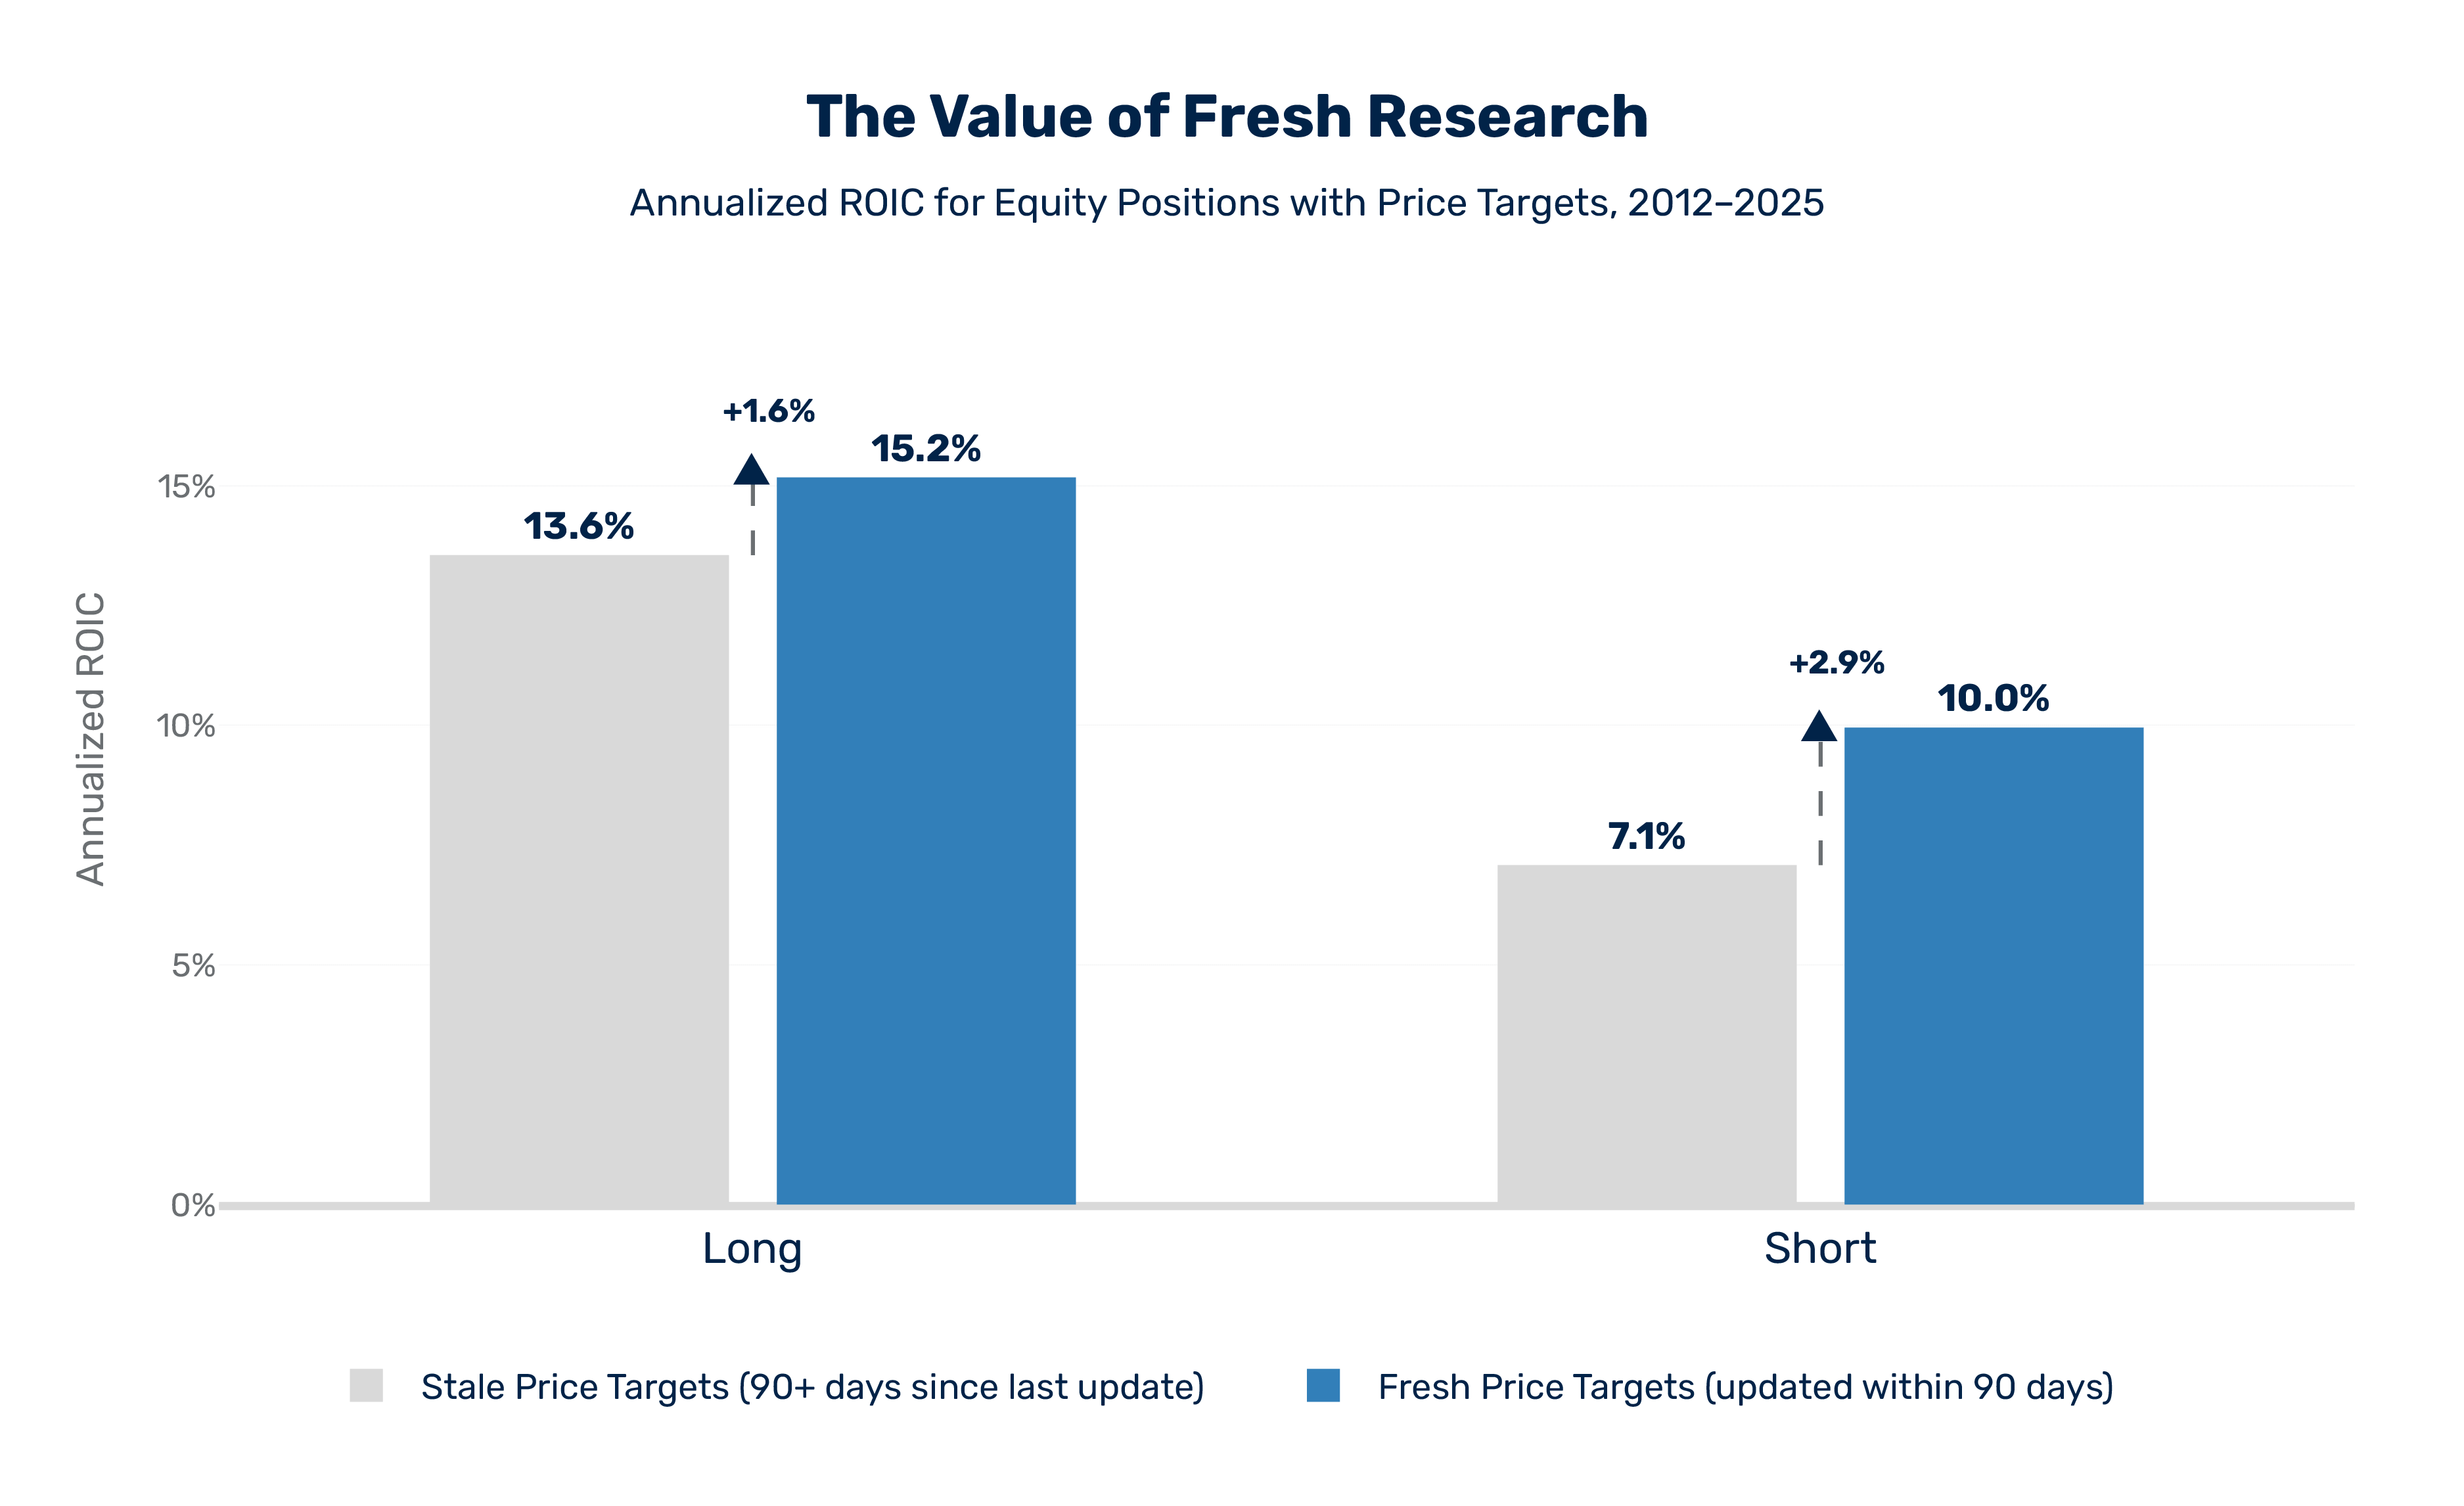
Stale targets imply a level of conviction the research no longer supports. The portfolio suffers from it. Keeping targets fresh is a discipline, and it pays.
3. Align Position Size with Idea Quality
This is where the research process ties directly into portfolio construction. Alpha Theory's Optimal Position Sizing (OPS) replaces discretionary adjustments and emotional decisions with a structured framework that links exposure directly to research conviction and projected return on investment.
The result is disciplined expression of research conviction through position sizes, which, as the data shows, leads to materially better outcomes. For a deeper explanation of how OPS works, see Turning Intuition into Alpha.
What Better Sizing Actually Looks Like
The impact of better sizing shows up in two measurable ways: hit rate and payoff asymmetry.
Hit rate (analogous to batting average) measures how often positions are profitable. Payoff asymmetry (like slugging percentage) measures how much is made on winners relative to what is lost on losers.
Higher Hit Rate (Batting)
Under Optimal Position Sizing, a greater percentage of positions are profitable. Positions without documented research are excluded, and higher-conviction ideas carry more weight in the portfolio. The result is a meaningfully higher hit rate (see Figure 5).
.png)
Improved Payoff Asymmetry (Slugging)
The same discipline that improves frequency also improves the magnitude of returns.
To understand this improvement, we break payoff asymmetry into two components: average winners and average losers.
In Figure 6, we see that under OPS, winners go up a little more and losers go down a little less. Those small improvements compound into a 26% uplift in the overall slugging to 1.35x vs 1.07x.
.png)
The data points to the power of disciplined gain expansion and loss compression. By aligning exposure more closely with idea quality, expected return, and risk constraints, managers improve the ratio of average winners to average losers. OPS doesn’t simply increase risk; it translates conviction into portfolio outcomes more consistently and efficiently.
These improvements in hit rate and payoff asymmetry are not isolated observations, but persistent patterns across managers and market cycles.
The Edge Is in the Implementation
Across 14 years, 200+ managers, and more than one million price targets, the data keeps pointing to the same conclusion: the gap between being in the 90% that trails the benchmark and the 10% that beats it is not about finding better ideas. It’s about implementing the ideas you already have more precisely.
That edge has been worth +3.9% annually, compounding into nearly 2x the returns over 14 years.
The opportunity, in many cases, lies not in generating more ideas but in implementing the ideas already in the portfolio more consistently. Position sizing is where research conviction meets capital allocation, and where much of the potential return is either realized or lost.
Managers who close that implementation gap give themselves a better chance of being among the minority of funds that consistently outperform their benchmark.
Alpha Theory was built to help managers close that gap.
.png)