.svg)


Checklist Checkup
At Alpha Theory, we’ve spent quite a bit of time working with portfolio managers to create checklists with a mix of fundamental, technical, statistical, risk, qualitative, and quantitative metrics. Read more on why this should become a standard part of the analyst research process.
This is a continuation of my previous post - http://blog.alphatheory.com/2014/09/instinct-to-analytics-a-decision-making-spectrum.html
At Alpha Theory, we’ve spent quite a bit of time over the past year working with portfolio managers to create checklists. The checklists are a mix of fundamental, technical, statistical, risk, qualitative, and quantitative metrics. They’re basically the pieces of the puzzle that aren’t explicitly captured by price targets and probabilities. Here’s an example of some of the potential inputs:
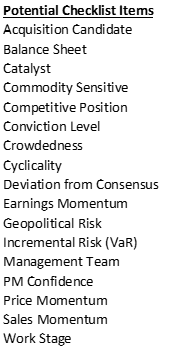
Understanding that we’re trying to strike the right balance of scope of inputs and impact to workflow, most clients have a list that consists of 3-6 of these that are most important to them.
The next step is to score these items. The natural reaction is to score on a scale of 1-5 or 1-10 where 1 is the worst and 10 is the best. This is generally how surveys are designed and how we rate restaurants and hotels. The problem is that we’re measuring subjective variables (the checklist) using a subjective scale (1-10). The meaning of the scale can be different from one person to another (i.e. one person’s 6 is another’s 7) and an individual’s own internal scales can fluctuate with time and emotion.
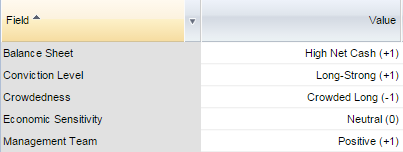
I suggest that clients use a simpler, less subjective scoring system. Basically a scale from -1 to +1, where -1 = Negative / 0 = Neutral / +1 = Positive. Let me give you an example. Let’s say we were measuring the Management Team. We could quickly assess whether management has a negative, positive, or neutral impact on the company easier than we could assign a rating of 1-10. Same for Balance Sheet, Catalyst, Earnings Momentum, etc. This helps frame the conversation when discussing the company in investment meetings. It is much easier to say that Earnings Momentum is a negative than to say they are a 3 out of 10.
Next, we can take these individual scores and create a composite Qualitative Score. For example, here’s the way it looks inside of Alpha Theory:
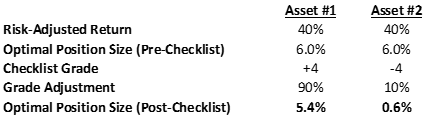
The resultant score would be on a scale from -5 (all negatives) to +5 (all positives). Then create a grade scale from 0% = -5 to 100% = +5%, where 0% = 50% (inverse for shorts). The scale would be used to adjust the suggested position size. For instance, imagine we have two assets with similar Risk-Adjusted Returns based on their price targets and probabilities (see below). Without the checklist, these two assets would be similarly sized. With the checklist, the portfolio manager gets a more intuitive result that incorporates both the price expectation and non-price expectation factors.
When dealing with shorts, it is best to ask analysts to score with the question, “is this factor a positive or negative for the company?” as opposed to, “is this factor a positive or negative for the investment?” Let me give you a couple of examples that explain the logic. Let’s assume the company has a highly leveraged balance sheet. The score for a long and a short would be -1, because a highly leveraged balance sheet is bad for a long and good for a short. Same for Crowdedness and Management Team (see below).
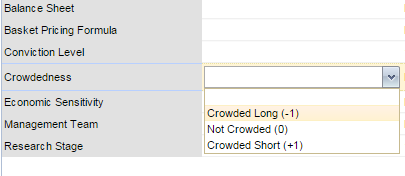
Other input are a bit more complicated. Research Stage, Economic Sensitivity, Conviction Level, for instance, require a distinction for long versus short. For example, if our Conviction Level is “Strong” for a Long it needs to be +1 and if it “Strong” for a Short it must be -1 (see below).
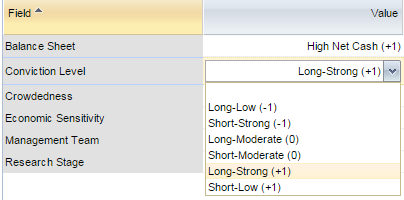
Once this is properly laid out in dropdown form, it isn’t very complicated. Proper scoring is important because it feeds historical analytics. A firm should use this data to analyze, “do negative Balance Sheet scores underperform” or “do high Conviction Level scores outperform”. The goal is to find the metrics with high correlations and to determine the veracity of the overall score’s influence on position sizing (i.e. +4 longs do what we expect more often than +2 longs / -4 shorts do what we expect more often than -2 longs). It is important to make the distinction between outperformance and confidence when measuring the success of the overall score. The checklist does not factor in the risk/reward of the bet, so it should be used to influence your confidence in the idea. We shouldn’t expect better overall scores to necessarily “outperform” the lower scores, because their expected returns could be wildly different. What we would want to measure is, “was my expected return more likely to be realized with a better checklist score?” The distinction between measuring the validity of individual components like Crowdedness and Conviction Level versus the Overall Score is important, but either way you look at it, the ability to measure predictive quality and efficacy goes way up.
What we’ve created through the Checklist methodology is a way to:
1) Properly pull out the relevant/influential information from analysts
2) Make sure they don’t overlook important factors
3) Directly connect it to position sizing
4) Measure its efficacy
The work required to build a checklist is low and the benefit is high. Over the past ten years, we’ve seen first-hand, the adoption of probability-weighted price targets across much of the industry. The Checklist is a natural evolution from probability-weighted targets and we expect it will become a standard part of the analyst research process over the coming years.
.png)