.svg)


The Day The Music Died
In this article, Cameron Hight explains how he uses data to create his Fantasy Football sheet and the importance of having an edge in your processes or analytics.
For the past few years, I have had a significant edge in my fantasy football leagues because of my pre-draft preparation. Each year, I would go online to do my preparation before the draft and pull data from multiple sources and look around for novel analytical approaches to player selection which I could combine with the data I was able to source. Unfortunately, it looks like the years of my fantasy football spreadsheet’s domination has come to an end. I knew this day would come. Each year the data and analysis I was running sourcing seemed to get better and better. This year, I found 95% of my bespoke spreadsheet already prepared by someone else online at: http://apps.fantasyfootballanalytics.net/. Undoubtedly, several of my competitors found it too.
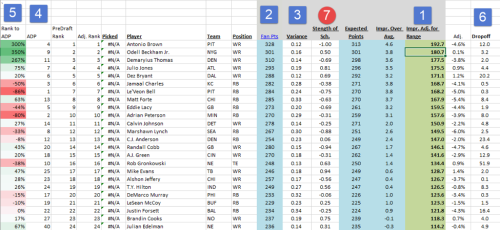
Key attributes of my fantasy football sheet:
1. Improvement over Average (also called Value over Replacement) – this is by far the most important attribute. It basically states how much better any particular player is to the average player that will be drafted at the same position. Without IOA, the players with the highest potential points will always pop to the top, which is inaccurate because you can’t fill a team with just one position. For example, a QB may be forecast to score 350 points over the year and a WR is forecast to score 325. On that basis, the QB looks like the favorite. But the average drafted QB will score 280 and the average drafted WR will score 180 points. That means that the WR will add 145 points (325-180) against other teams vs the QB which will only add 70 points (350-280).
2. Multiple Sources – I pull projections from multiple sites to create a “wisdom of crowds” improvement.
3. Forecast Risk – measure standard deviation of projections from multiple sites to see how likely a player was to hit the average I was using in my model.
4. Average Draft Position – pulled Average Draft Position from multiple sources to compare my ranking to what was likely to happen.
5. Over/Undervalued to Average Draft Position – this allowed me to see if a player that my sheet really liked, could be selected in a later round because folks on average were drafting him later.
6. Dropoff – used to quickly see how big the difference is between the player and the next best player at the same position.
Now let’s compare to FFAnalytics.net:
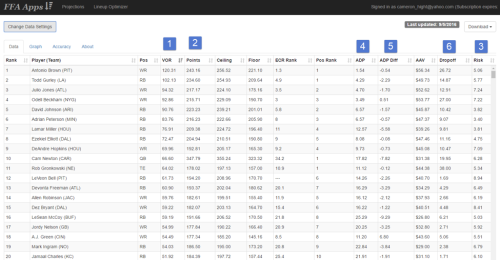
The only thing my sheet has is a Strength of Schedule adjustment (#7) and I can just add that in after I download the data.
My reasons for writing this blog are two-fold. One, I want everyone to feel sorry for me that my edge is gone. Two, we all should recognize that with each passing year, data becomes easier to access and manipulate. If there are things in your business you consider your “edge” (competitive advantages), do a careful assessment of the landscape and forecast the probability that it can be undermined by data ubiquity, data analytics tools, or machine learning (artificial intelligence). Old businesses are being disintermediated in a matter of a few years by the likes of Google, Alibaba, Amazon, Uber, AirBNB, etc. Asset managers would be well served to take a hard look at what parts of their spreadsheets/processes and analytics are no longer novel and which are likely to persist and contribute as their true “edge”. Without an edge in your processes or analytics, there is a limited likelihood that they will see an “edge” in their returns.