.svg)


March Madness Math 2.0
Not only is Alpha Theory helpful for investment and portfolio management, it can actually be used in March Madness predictions as well. See the relationship here.
I love college basketball and have been a Tarheels fan my whole life. I’m a graduate of UNC-Chapel Hill (home of Michael Jordan) and grew up thirty minutes from campus. So, if you’re anything like me, you’ll spend too much time this week putting together your bracket.
In Alpha Theory fashion, I built a systematic approach to filling out my NCAA brackets. I wrote about it 10 years ago, but since then, I’ve scratched it because FiveThirtyEight.com has built a better version for me.
I was showing some of my colleagues the old NCAA spreadsheet tournament and realized that KenPom.com no longer reports the Pyth statistic. If you’ve read the previous post on my method for creating a bracket, you will see that I used Pyth along with Log5 to calculate win percentage. Apparently, the change happened in 2017, but I’ve been taking the shortcut through FiveThirtyEight so I haven’t noticed (see my reasons below).
But if you’re curious about the rabbit hole I went down to use KenPom’s new statistic, AdjEM, to calculate Win Percentage, the rabbit hole awaits below.
How to Calculate Win Percentage using KenPom
For those curious to understand an updated method to calculate Win Percentage for KenPom, here is an example with formulas:
Boise State (8) plays Memphis (9) in the first round. First, calculate the expected point differential (I pulled the formula from Reddit). AdjEM (Adjusted Efficiency Margin) is the number of points you would expect this team to beat the average Division 1 team by, if they played 100 possessions. The AdjT (adjusted Tempo), is a way of accounting for Tempo, or how many possessions they actually play.
PointDiff = (AdjEM_A - AdjEM_B)*(AdjT_A + AdjT_B)/200
PointDiff = (A – B) * (C + D) / 200 – see below
PointDiff = (16.41 – 16.22) * (64.6 + 70.3) / 200 = 0.13 Boise St. point advantage
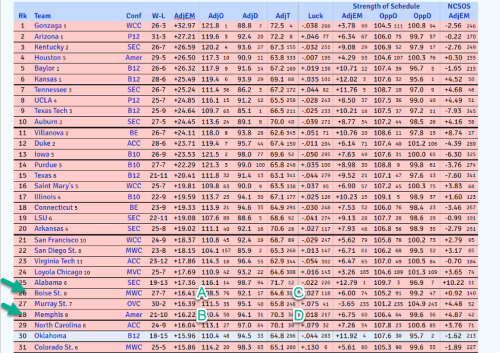
Then, in Excel, use the =Norm.Dist(x,mean,StDev,distribution) function. In this case, it would be:
=Norm.Dist(0.13,0,11,true) = 50.5% probability that Boise St. is going to win. Makes sense that it is a coin flip given that Boise St. is only favored by 0.13 points. Why 11 for the StDev? That’s what KenPom suggests here as the average StDev for NCAA basketball.
Why I Use FiveThirtyEight
The main reason I use FiveThirtyEight is because it uses multiple sources and, well, KenPom is just one source. For comparison, Vegas odds have Memphis winning by 2.5 points vs. losing by 0.13 points on KenPom. That’s a 59% probability of Memphis winning using the formula above. FiveThirtyEight has a 54% probability of Memphis winning. I believe that the best answer comes from the wisdom of the crowd.
The nice folks at FiveThirtyEight have taken the time to crowdsource many great thinkers, including KenPom and themselves (using their Elo method), into one forecast (see here or the schema below).
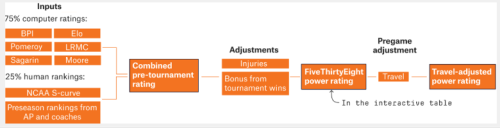
Also, they have this nifty little Excel downloader which makes life so much easier. So, while it was a fun intellectual challenge to build forecasts using the Monte Carlo simulations based on KenPom win probabilities, I can’t compete with FiveThirtyEight.
We all should strive to constantly improve our process. KenPom improved their process by switching from Pyth to AdjEM. FiveThirtyEight changes their weightings, sources, and adjustments. I realized that I was better served by using an external source versus my internal solution.
And, in the same way Ken Pomeroy’s AdjEM is updated after each game played, or FiveThirtyEight updates probabilities, fresh price targets and probabilities in Alpha Theory lead to better sizing recommendations because they reflect your most up-to-date beliefs about the future performance of your investments. Luck is not a strategy. Unlike a Vegas casino, you don’t have a built-in edge. Your edge is your process. Build it. Refine it. And then win.
Contact us if you are interested in how we partner with fund managers to define and implement disciplined, repeatable processes that ultimately lead to confident decision making, driving portfolio optimization.
.png)