.svg)


March Madness 2013 - Your Mom Always Wins
In this article on March Madness, Cameron Hight references the article "KenPom vs Your Mom" by Peter Tiernan about comparing the new BPI system to KenPom.
I first posted the blog below in 2012. As I'm preparing my brackets for 2013, I was referencing this post as a reminder of how to operate the machine I built last year. First step, download data for 2013. I typed in KenPom.com to get Winning Percentage scores to drive my March Madness Machine. KENPOM.COM WAS DOWN!!! Apparently, I'm not the only one heading to the KenPom site to get my stat fix (apparently the NCAA site was down for a little while too). So, what do I do? Be patient and wait for the mad rush to subside? No, I do a Google search for KenPom to see if I can find a backdoor. No luck, but I do come across this article that may change everything: KenPom vs Your Mom.
The article was written by Peter Tiernan who has been using stats to analyze March Madness for 22 years (this according to his bio) and is an expert that writes for CBS during the tourney. The point of the article was to compare the new BPI system to KenPom. No need to go into results here, but basically no real difference. The more interesting section of the article was the comparison of KenPom to Your Mom. "Your Mom" is basically, just picking the higher seed in every round.
"Okay. So I did one other analysis yesterday—and I think it’s more relevant than determining round-by-round prediction accuracy. This analysis compared the accuracy of KenPom to YourMom in filling out your entire bracket and living with the consequences of lost games in previous rounds. I was able to go back nine years for this analysis. What did I find? Using KenPom efficiency data would’ve predicted 376 of the 567 tourney games played between 2004 and 2012. That’s a 66.3 percent accuracy rate. And how would’ve YourMom done? Amazingly, two games better—for a 66.7 percent accuracy rate. That’s right. Picking by seeds and margin beats out using KenPom."
Your Mom wins!!! Actually, this isn't that surprising. I've filled out my bracket using KenPom and Vegas odds for many years and I always notice that I'm pretty much picking the higher seed. Very rarely (and I'm not counting 9 vs. 8) does the underdog have a higher KenPom Winning Percentage, so I pretty much end up filling out my bracket picking the higher seed. I knew I ended up picking more favored seeds than the average bracketeer but now I have some emperical evidence to support my choice.
Here's the rub, most NCAA pools only pay 3 places. Over the long-run, I will almost certainly be better than average, but randomness places in the the top 3 spots more often than not. For example, imagine I'm competing in a pool with 99 others. Assume all 99 are randomly generated and assuming my method is the superior statistical method, I still have a very low probability of finishing in the Top 3. This goes down even further if there are 1000 participants.
What does all this mean? I'm sticking to small office pools or pools with Cinderella points (extra points for picking upsets) and I will not be offended when someone calls me a moron for picking every favorite.
2012 Blog Post:
AUTHOR’S NOTE: My second child was born less than 24 hours ago but I felt like I had to get this out by tip-off. Please excuse any errors.
I love college basketball. I’m a graduate of UNC-Chapel Hill (home of Michael Jordan) and grew up a fan living thirty minutes away. Needless to say, I spend a little too much time filling out brackets and watching hoops during business hours this time of year. And in the spirit of all things Alpha Theory, I have a systematic approach to filling out my NCAA brackets. But my system needs a little fine tuning. I’ll give a little background to set up the problem and hopefully someone will have an answer.
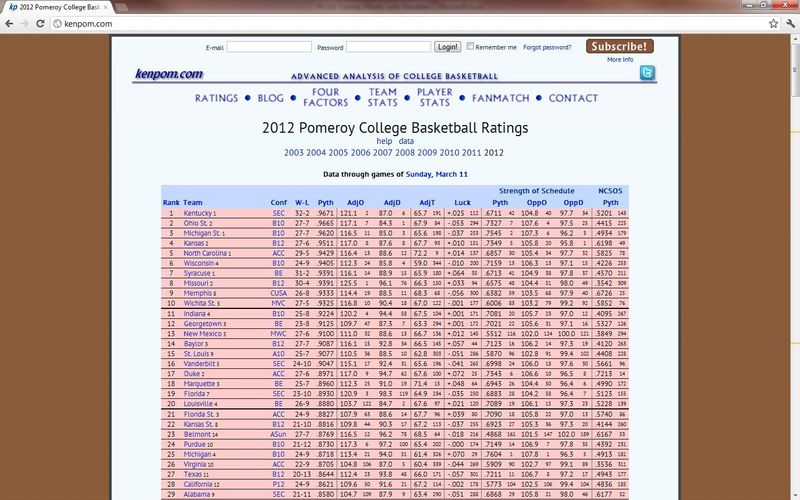
GENERATION ONE. Creating a systematic approach to fill out the brackets requires good input. From 2008-2011, I took Vegas odds for each team to win the national championship to serve as a proxy for team quality and strength of the path they’ll have to travel. For an example of the calculation, see the chart below. Kentucky is the favorite at 8/5 odds. If I bet $5 on Kentucky and they win, I receive $8. That assumes that 8 times out of 13 (8+5) Kentucky will win or 61.5%1 (8/13). The next step was to calculate the percentage for every team in the tourney, sum up all the percentages, and divide the individual teams win percentage by the sum of all the percentages to get a true probability of winning the tourney2. The next step was to use those probabilities to create a forecasted probability of winning for one team versus another. For example, if Kentucky (29% chance of winning it all) plays Missouri (4.6% chance) then the adjusted probability of Kentucky winning is 86% (29% / (29% + 4.6%)). At this point I could have filled out my brackets using a random generation (i.e. use a random number generator to pick a random number between 0 and 100 and if it falls above 86 then Kentucky loses, and if it falls below, they win. Or I could have just used Vegas probabilities to pick the winner which pretty much means picking the Vegas favorite in each round. But here is the problem, Vegas odds don’t give the granularity necessary to pick the early round games because they make very little differentiation between teams (see the clusters of odds below).

GENERATION TWO. While looking for a solution, I came across KenPom.com. This is a sophisticated site steeped in the teachings of Bill James, the pioneer that created the statistics that led to the Moneyball movement. KenPom creates an adjusted winning percentage that controls for a multitude of factors. This winning percentage allows for comparison of teams across the spectrum. Additionally, in the KenPom blog there is reference to the Log 5 method which takes two teams’ winning percentages to determine the probability of one team beating the other. This is the breakthrough I was looking for.
This allowed my NCAA bracket generator to have much more precise winning probabilities and thus a much more accurate forecasting engine. Here are the brackets based off KenPom adjusted winning percentages and Log 5-based probability of head-to-head success:
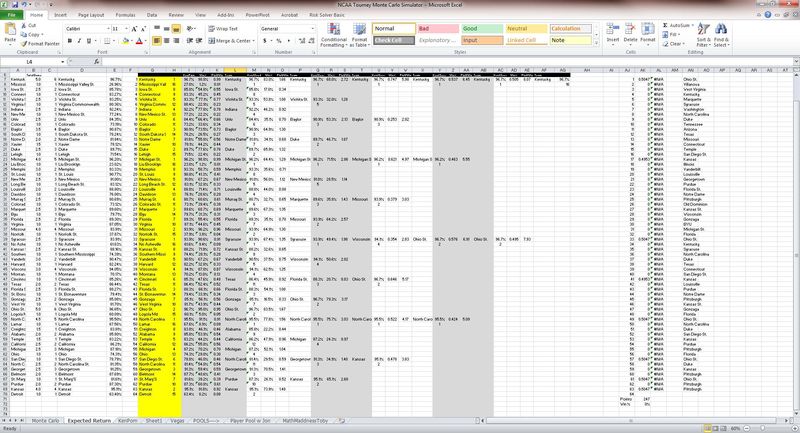
THE PROBLEM. Now here is the rub. Let’s say that I’m playing in an NCAA pool that has Cinderella points (1 point added for each point of difference in the seed). I can calculate an expected return using the probability of winning (i.e. Wichita St. (#5 seed) versus VCU (#12 seed) – KenPom is 93.5% and 80.4% respectively). Using Log 5 we calculate a 77.1% chance that Wichita St. wins the game. The expected return for Wichita St. is 77.1% * 1 pt = .8pts and the ER for VCU is 22.9% * (1pt for win + 7pts for seed) = 1.8pts. In this case you would pick VCU because they give you an expected value of 1.8 versus .8 for VCU. If the tournament were one round, this method would maximize expected return. But if I pick VCU to beat Wichita St. in the first round, then I can’t use Wichita St. in future rounds. If I wouldn’t have chosen Wichita St. or VCU to move beyond the second round, then I should definitely pick VCU in the first round because there is nothing lost for not having the right team lose in the second round. But if I would have had Wichita St. win a future round, which I would have in this case, then I’ve done myself a disservice by eliminating them in the first round to maximize first round expected return.
I’m looking for a good way to account for this dynamic. I’m assuming someone with a good grasp of Bayesian/Stochastic tools may have a solution. Anyone have a suggestion? I would be glad to send my sheet along to anyone that would like to try and take a stab at solving the problem or would just like to use the sheet. Please help me solve this March Madness Math.
1 Clearly 61.5% is too high a chance of Kentucky winning the tournament. But if Vegas used realistic probabilities, then they wouldn’t make money from the spread. But how unrealistic are the probabilities that they use? Let’s assume that Kentucky is the best team in the country by a wide margin and figure out the odds of winning the six games necessary to win the national championship:
First game – 100%, no chance they lose. If they play 100 times, they don’t lose once.
Second game – 95%, they’ll be playing an 8/9 seed, play 100 times, they lose 5.
Third game – 80%, playing a 4/5 seed
Fourth game – 70%, playing a 2/3 seed
Fifth game – 65%, playing a 1/2 seed
Sixth game – 60%, playing a 1/2 seed
Multiply them all together and the probability of winning is 21% for the best team in the country. Even if I raise the winning percentage to 80% for all the rounds from the third round on, it is still only 39%. So 62% odds are off the chart and tell you how expensive it is to do prop bets in Vegas. What this also tells us is that fans really shouldn’t be upset when their team doesn’t win the national championship. The odds of the best team in the country are only slightly better than rolling a die and landing on 1. Take solace in the fact that single elimination tournaments are subject to all kinds of luck and be happy that your team is dancing.
2 Sum is greater than 100% because Sportsbooks make their money from the spread. If the odds were reflective of the real probability, then Vegas would just breakeven…and we can’t have that can we? For example, Kentucky is forecasted by Vegas to have a 62% chance of winning it all, but adjusting by the sum total of all teams’ odds of winning, which is 215%, the true Vegas probability of Kentucky winning it all is 29% (61.5%/215%). So instead of paying $1.60 (8/5) for each dollar bet, Vegas should actually be paying $3.50 for each dollar bet. Needless to say, the futures bet on NCAA champs is a real suckers bet.
.png)