.svg)


New Probability of Success Calculation (Improving Batting Average Analysis)
Alpha Theory CEO Cameron Hight discusses a new calculation for probabilistic forecasts of a stock price in the third part of the Probability of Breaching Price Targets series.
Part of Alpha Theory’s partnership with clients is to help them figure out how well they make probabilistic forecasts of a stock price. A couple of recent blog posts (Probability of Breaching Price Target – Part 1 and Part 2) have made us rethink our methodology.
Previous Methodology:
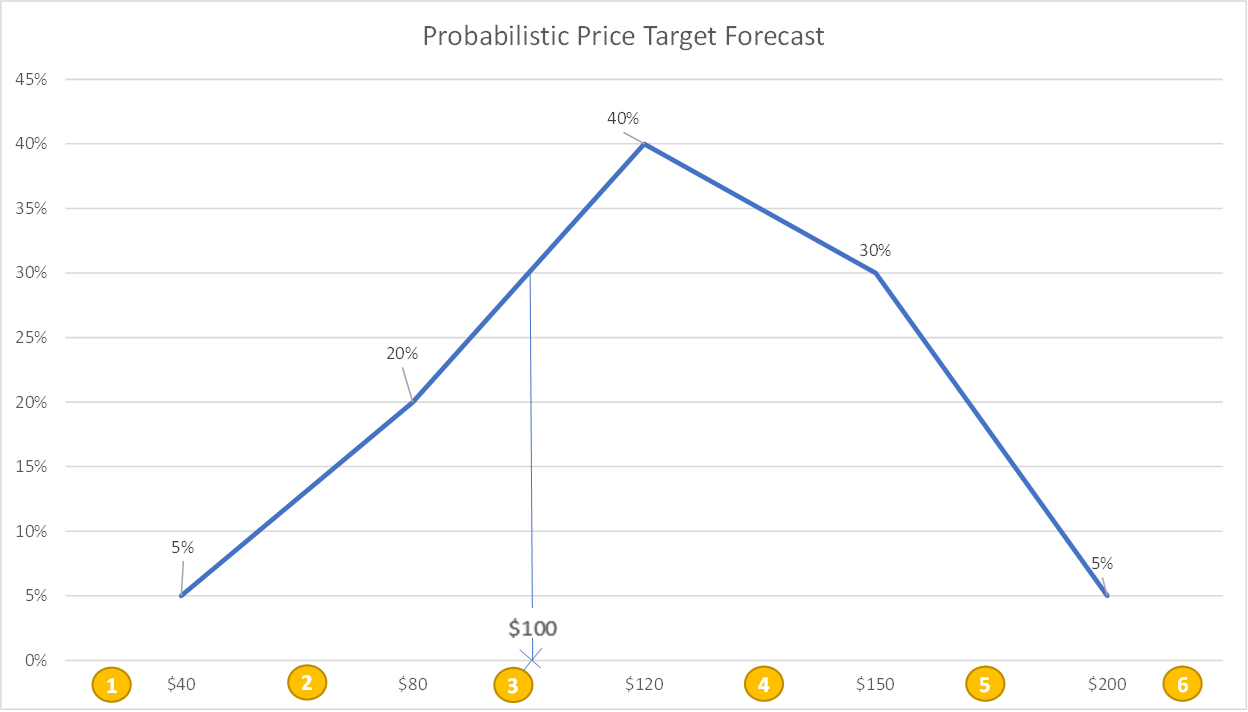
To calculate an analyst’s forecast of making money, we would simply add up the probability for scenarios that have positive expected returns. In this case, the stock is trading at $100, and the analyst has three positive scenarios of $120, $150, and $200 with probabilities of 40%, 30%, and 5%, respectively. That represents a 75% probability of success in total. We would then compare that to the analyst’s actual batting average (we’ll assume 55%) and this forecast assumes a probability of success 20% greater than the analyst's historical average of 55%. This method has always seemed less than ideal because it uses the same probability of success no matter where the current stock price lies between the price targets.
New Methodology:
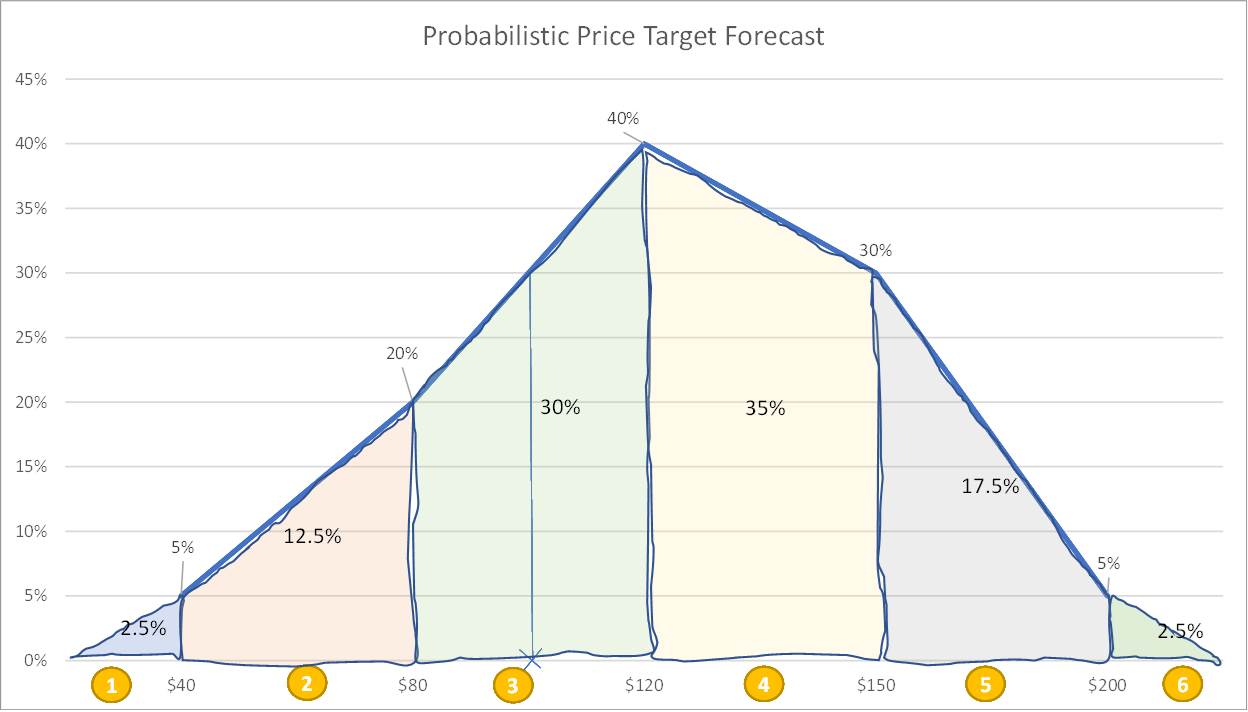
We have developed a solution after several conversations with clients and readers responding to our previous blogs on the Probability of Breaching Price Targets – Parts 1 and 2. We start by breaking the distribution into bins with associated probabilities of falling in the bucket (probability of bucket = average of probabilities at top and bottom of bin):
The next step is to take the bin of the current price and split it into segments above and below the current stock price of $100 (see the 3rd bin broken into its relative probabilities and the steps on the right-hand side):
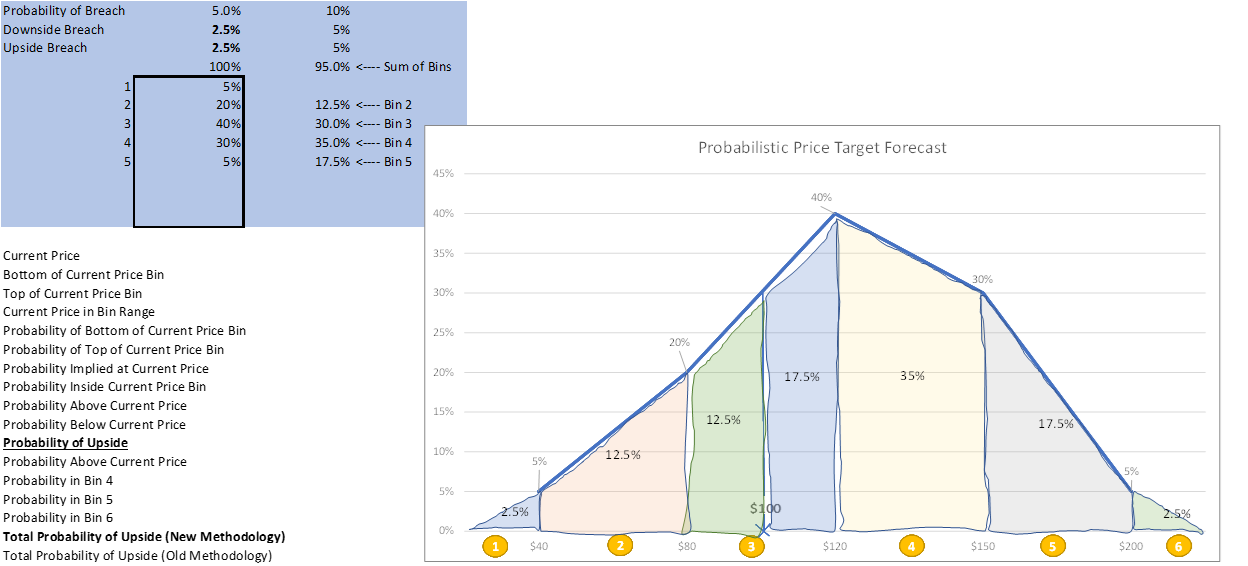
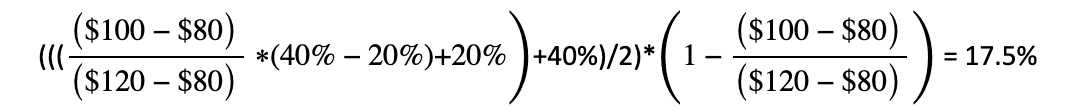
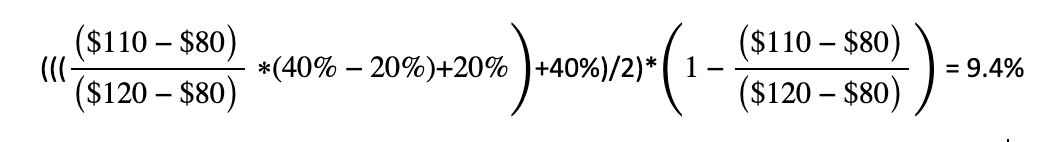
In this case, the probability of being in the 3rd bin but above the current stock price of $100 is 17.5% (blue area in bin 3):
So, the total probability of upside would be 72.5% (17.5% (top of bin 3)+ 35% (bin 4) + 17.5% (bin 5) + 2.5% (bin 6)) versus our historical estimate of 75% (40% + 30% + 5%). This is the accurate estimate of the probability of upside and becomes more apparent why it is important as price changes. Now let’s assume the price moves to $110.
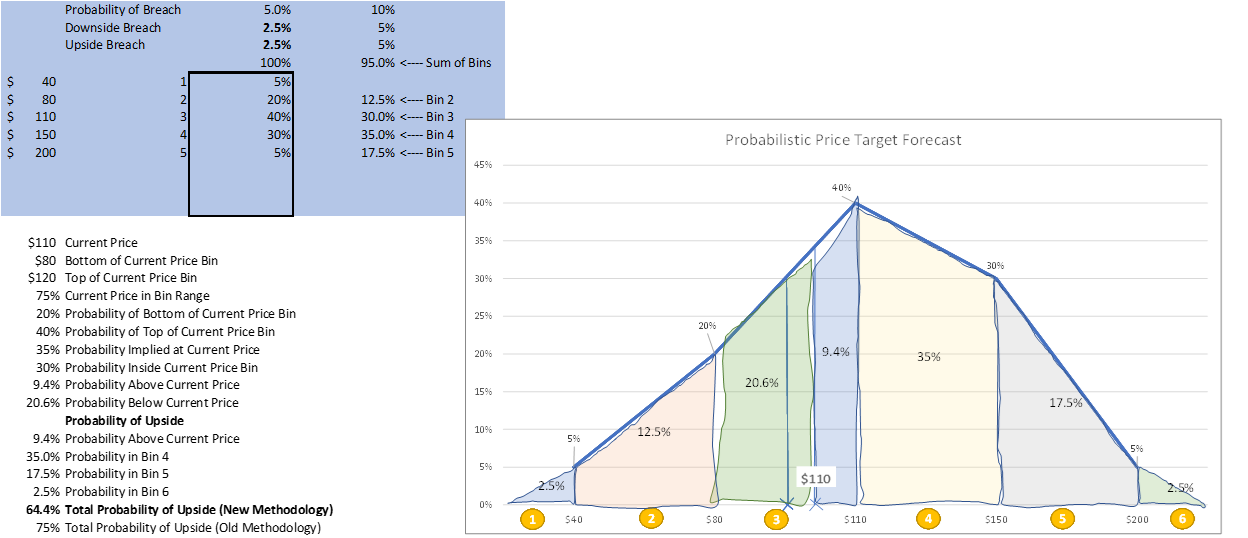
Now the implied probability of upside in the analyst’s forecast is only 64.4% (9.4% + 35% + 17.5% + 2.5%) versus the old method which still assumed 75% when the stock moved to $110.
This is a better approach that we’ll be implementing over the coming months for all our client analyses, and it came from you, the readers of this blog. The folks that are the Alpha Theory Ecosystem of process-driven, probabilistic thinkers. Thank you!